|
|
|
Porsche, and the Porsche crest are registered trademarks of Dr. Ing. h.c. F. Porsche AG.
This site is not affiliated with Porsche in any way. Its only purpose is to provide an online forum for car enthusiasts. All other trademarks are property of their respective owners. |
|
|

  |

| Superhawk996 |
 Jun 18 2026, 02:19 PM Jun 18 2026, 02:19 PM
Post
#1
|
|
914 Guru  Group: Members Posts: 7,903 Joined: 25-August 18 From: Woods of N. Idaho Member No.: 22,428 Region Association: Galt's Gulch |
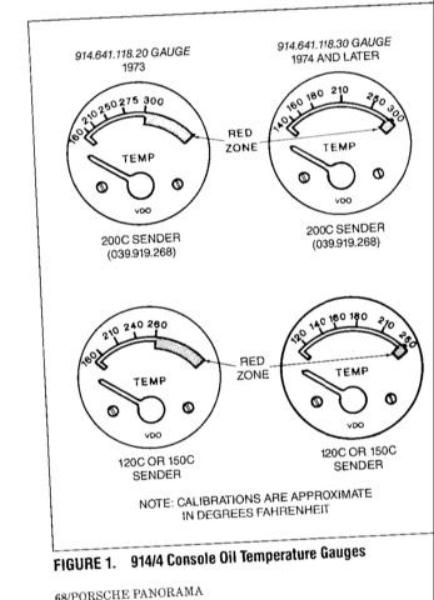
I think most people are familiar with the Panorama calibration graphics.
 What I haven’t been able to find is the actual calibration curve for the 200C temp sensor that goes into the taco plate. So . . . I went and got the data in an effort to help @ron914 troubleshoot his misbehaving oil temp gauge. Oil was heated and a Fluke thermocouple meter was used to read oil temp. The resistance of the 200C sensor was measured both while heating and then on the cool down to get the hysteresis. The pictures I’m going to attach later in this thread were done with a late oil temp gauge. The gauge I used pretty much matched the Panorama calibration graphics. Here is the chart 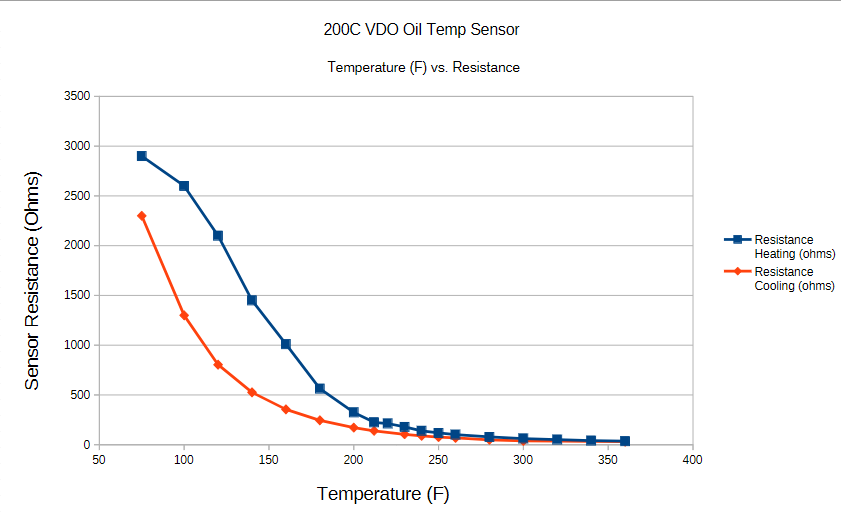 Here is the raw data. 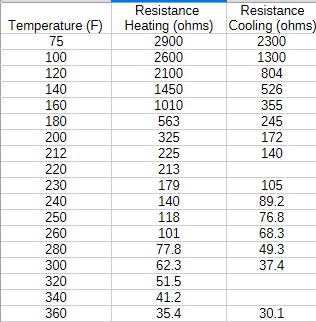 |
   |

 
|
| Superhawk996 |
Jun 18 2026, 02:21 PM
Post
#2
|
|
914 Guru Group: Members Posts: 7,903 Joined: 25-August 18 From: Woods of N. Idaho Member No.: 22,428 Region Association: Galt's Gulch |
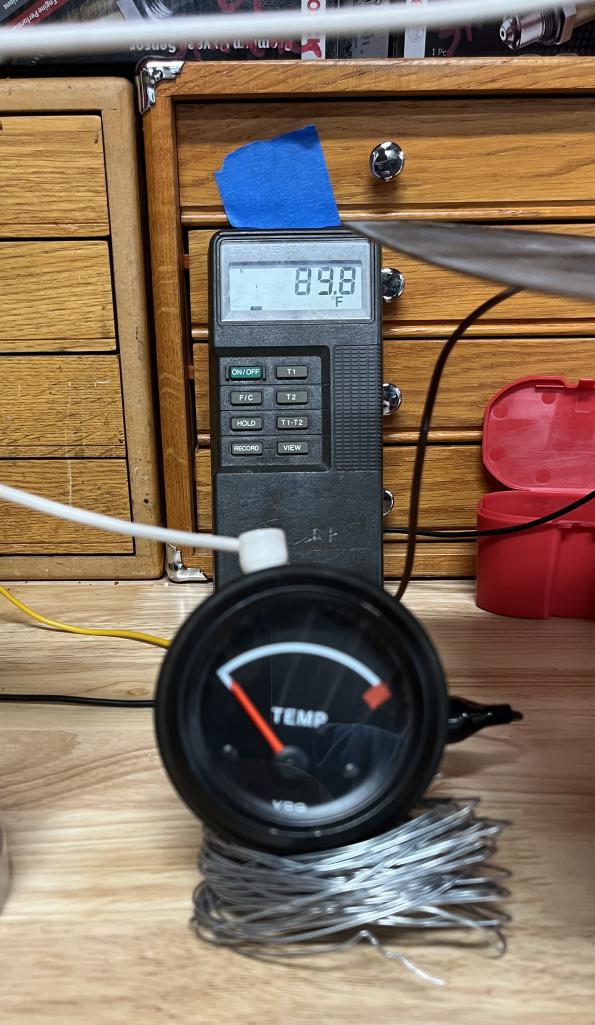
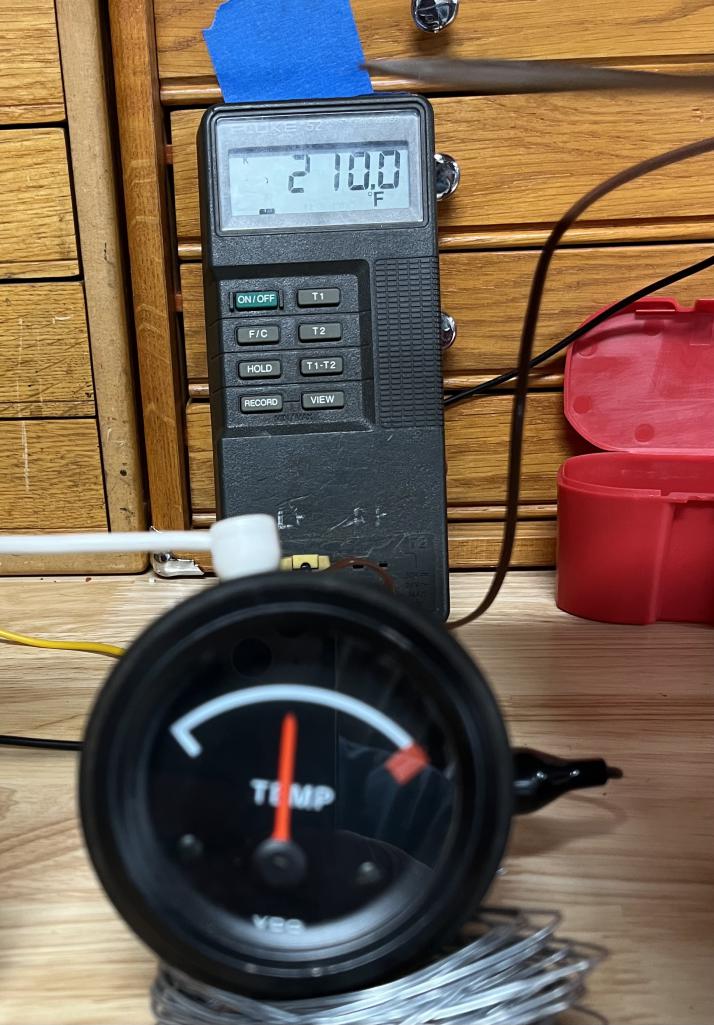
Just beginning - barely above ambient
 |
|
|
|
| Superhawk996 |
Jun 18 2026, 02:23 PM
Post
#3
|
|
914 Guru Group: Members Posts: 7,903 Joined: 25-August 18 From: Woods of N. Idaho Member No.: 22,428 Region Association: Galt's Gulch |
Right around 212 as a boiling water cal point
 |
|
|
|
| Superhawk996 |
Jun 18 2026, 02:25 PM
Post
#4
|
|
914 Guru Group: Members Posts: 7,903 Joined: 25-August 18 From: Woods of N. Idaho Member No.: 22,428 Region Association: Galt's Gulch |
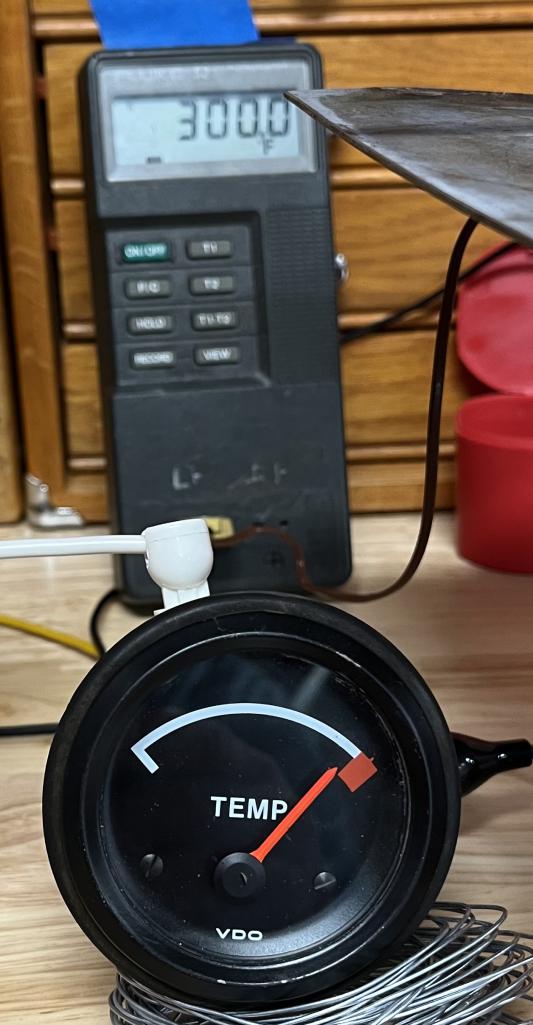
300F close to red zone
 |
|
|
|
| Superhawk996 |
Jun 18 2026, 02:26 PM
Post
#5
|
|
914 Guru Group: Members Posts: 7,903 Joined: 25-August 18 From: Woods of N. Idaho Member No.: 22,428 Region Association: Galt's Gulch |
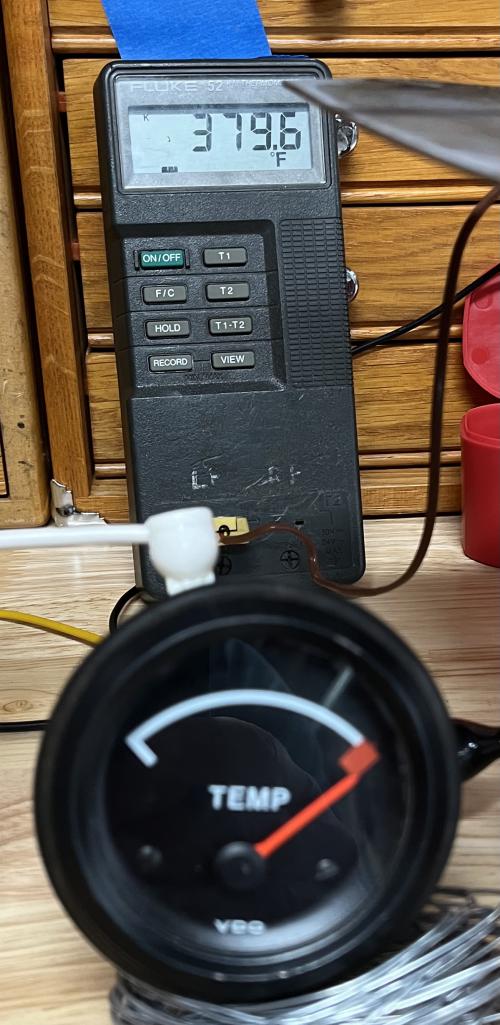
Deep into red
 |
|
|
|
| 914Sixer |
Jun 18 2026, 03:40 PM
Post
#6
|
|
914 Guru Group: Members Posts: 9,501 Joined: 17-January 05 From: San Angelo Texas Member No.: 3,457 Region Association: Southwest Region |
Late gauge your using should be 340 degrees at the the red point.
|
 |
|
| 930cabman |
Jun 18 2026, 03:41 PM
Post
#7
|
|
Advanced Member Group: Members Posts: 4,713 Joined: 12-November 20 From: Buffalo Member No.: 24,877 Region Association: North East States |
Post #4 is showing 300F and the factory gauge just about to enter the red area.
I'm not liking this picture My 2056 build (2023) I added a capillary tube gauge measuring at the bottom of the sump. Hope I am missing something |
|
|
|
| Superhawk996 |
Jun 18 2026, 03:45 PM
Post
#8
|
|
914 Guru Group: Members Posts: 7,903 Joined: 25-August 18 From: Woods of N. Idaho Member No.: 22,428 Region Association: Galt's Gulch |
QUOTE(914Sixer @ Jun 18 2026, 05:40 PM)  Late gauge your using should be 340 degrees at the the red point. Generally agree The Panorama calibration graphics show start of red as 300F as I interpret it. I do see about 340F at the little line on midpoint of the red zone. Regardless, the gauge lacks numbers due to the variability and hysteresis (below 200F) that limits absolute gauge accuracy. It is intended as a directional, trend indicator not an absolute indication. 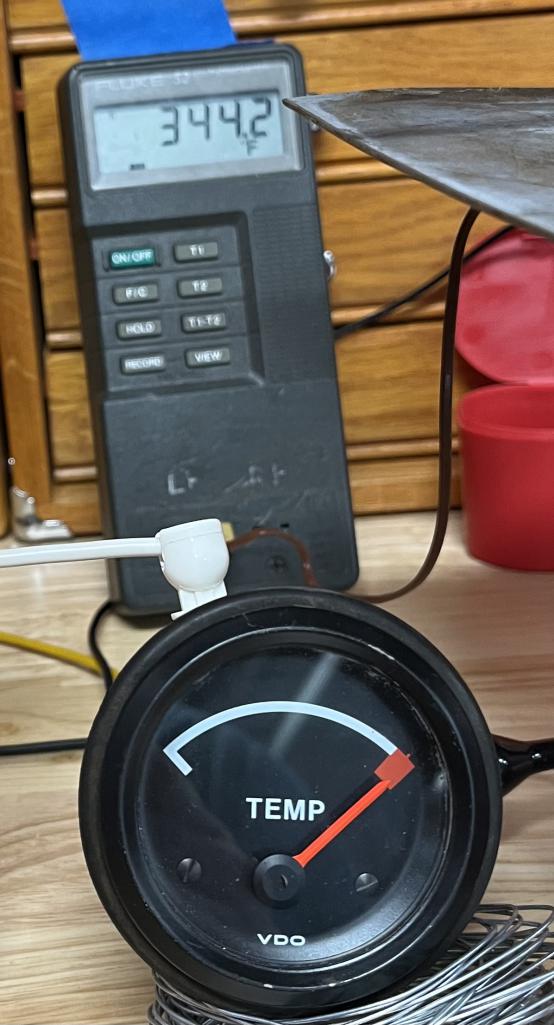 |
|
|
|
| Jack Standz |
Jun 18 2026, 05:47 PM
Post
#9
|
|
Senior Member Group: Members Posts: 839 Joined: 15-November 19 From: Happy Place (& surrounding area) Member No.: 23,644 Region Association: None |
Thanks for doing this testing. For us and for Ron.
We are looking to run our motors in the "goldy locks" temperature range. Not too cold. Not too hot. Just right. Now it looks like we will need to calibrate our new VDO gauges to feel more confident what temperatures, pressures, voltages, amps, etc. the gauges are measuring. (IMG:style_emoticons/default/sad.gif) Accuracy is underappreciated. (IMG:style_emoticons/default/smile.gif) Was considering running an EGT gauge even though the car will be run on the street only. Now will be adding one for sure. |
|
|
|
| Rusty_Rivets |
Jun 18 2026, 07:00 PM
Post
#10
|
|
Newbie Group: Members Posts: 11 Joined: 8-May 26 From: Canada Member No.: 29,392 Region Association: Canada |
Superhawk, when you did your tests, did you start heating the oil and then take readings throughout the heating process, and then again during the cooling process rather than letting the oil reach a stable temperature for each measurement? The reason I ask is because the difference in readings between heating and cooling look to me to be a time lag effect rather than hysteresis. (I think VDO would have to put a lot of effort into making a sensor with hysteresis that awful. (IMG:style_emoticons/default/smile.gif) ) It looks to me like the thermal mass of the VDO sending unit is greater than the thermal mass of the Fluke temperature sensor. So, by the time the VDO sensor has heated to a certain temperature, the surrounding oil bath is already hotter (or colder if cooling).
|
|
|
|
| Superhawk996 |
Jun 18 2026, 07:33 PM
Post
#11
|
|
914 Guru Group: Members Posts: 7,903 Joined: 25-August 18 From: Woods of N. Idaho Member No.: 22,428 Region Association: Galt's Gulch |
QUOTE(Rusty_Rivets @ Jun 18 2026, 09:00 PM) Superhawk, when you did your tests, did you start heating the oil and then take readings throughout the heating process, and then again during the cooling process rather than letting the oil reach a stable temperature for each measurement? The reason I ask is because the difference in readings between heating and cooling look to me to be a time lag effect rather than hysteresis. (I think VDO would have to put a lot of effort into making a sensor with hysteresis that awful. (IMG:style_emoticons/default/smile.gif) ) It looks to me like the thermal mass of the VDO sending unit is greater than the thermal mass of the Fluke temperature sensor. So, by the time the VDO sensor has heated to a certain temperature, the surrounding oil bath is already hotter (or colder if cooling). Insightful data analysis I did do a semi steady state when obtaining readings but it took far too long and I did begin taking readings without allowing a full equilibrium to occur. I was using a small quantity of oil and it becomes difficult to minimize the undershoot & overshoot of the oil temp at each data point with such a small thermal mass. You are correct that the hysteresis is more of the thermal lag of the brass sensor itself. You are correct that it isn’t the actual hysteresis of the NTC resistance element alone. The “hysteresis” won’t be that bad in vehicle due to the larger thermal mass of oil and the larger thermal mass of the engine case. I collected the data this way in an attempt to see what the resistance range might be. At the higher temps the “hysteresis” is less because the oil and temp sensor housing more quickly come to a steady state. As it approaches temps down below 200F it was taking 10-15 minutes to get a 20F temperature drop. As noted, these gauges aren’t meant to be considered absolute. They are there for a directional trend and an indication (red zone) that things are too hot. I collected this data primarily to assist Ron in troubleshooting his gauge that was wildly erratic. When he powered on his gauge it was jumping up about 1/4 of the way into the scale at ambient temp. This data was a means to making sure is sensor wiring didn’t have a partial short. Likewise, I had this late gauge that I’ve never checked and wanted to make sure it was functional and close to the Panorama calibration graphics. As a further clarification, I focused on the 212 data point and the average of four very steady state readings is 172 ohms. This falls comfortably between the heating and cooling data. Hope that all helps it make sense. |
|
|
|
|
3 User(s) are reading this topic (1 Guests and 0 Anonymous Users)
2 Members: Superhawk996, porschetub

|
Lo-Fi Version | Time is now: 18th June 2026 - 08:01 PM |
Invision Power Board
v9.1.4 © 2026 IPS, Inc.